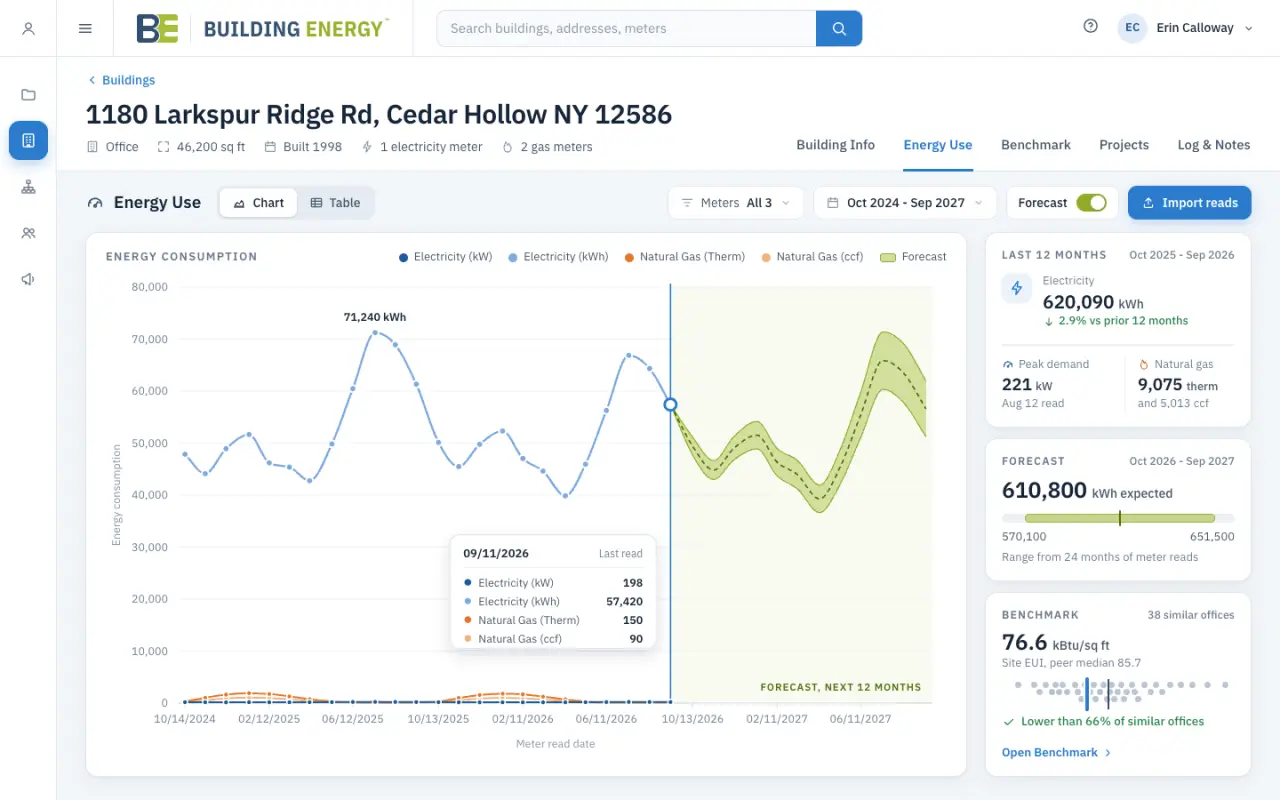
A working calculator on AngularJS, Elasticsearch, a geocoder and Django REST Framework. After it the client kept us on for new front-end design and features, back-end work and the site's administration.
Business context
What the client needed
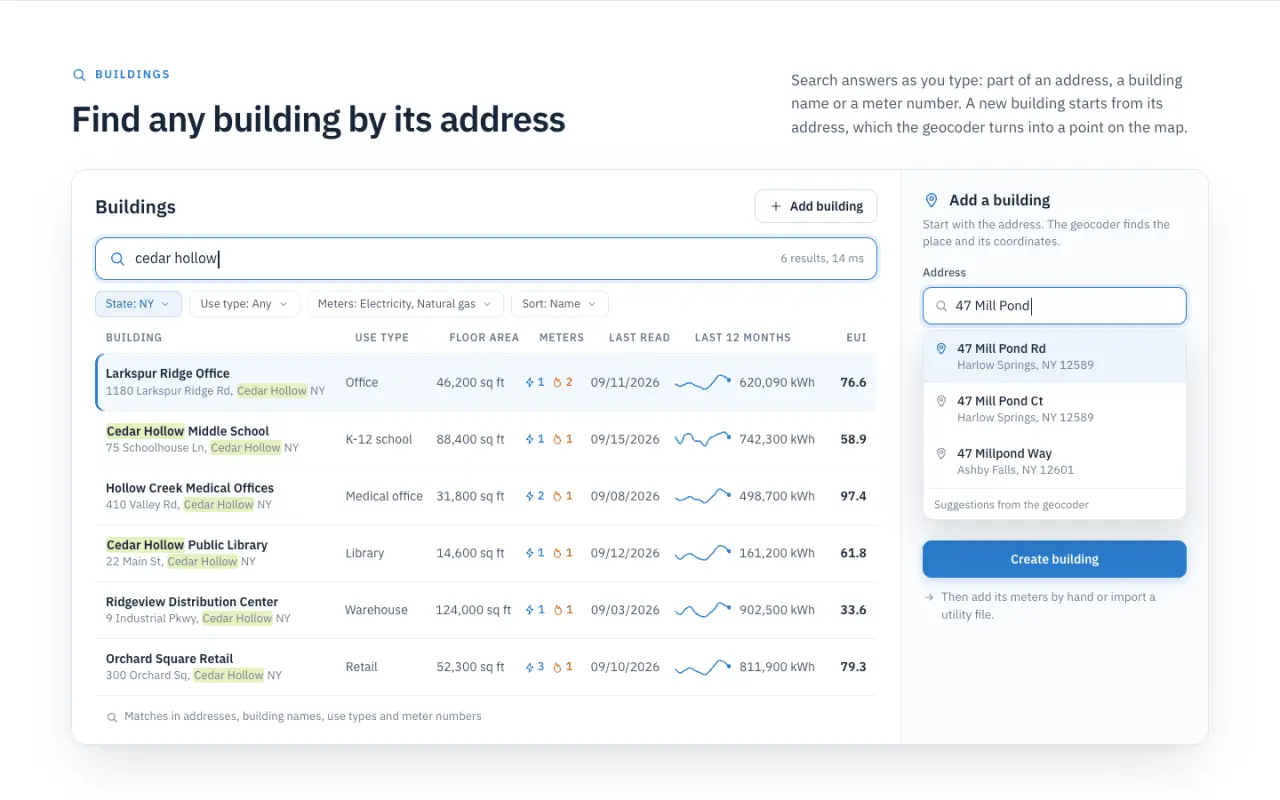
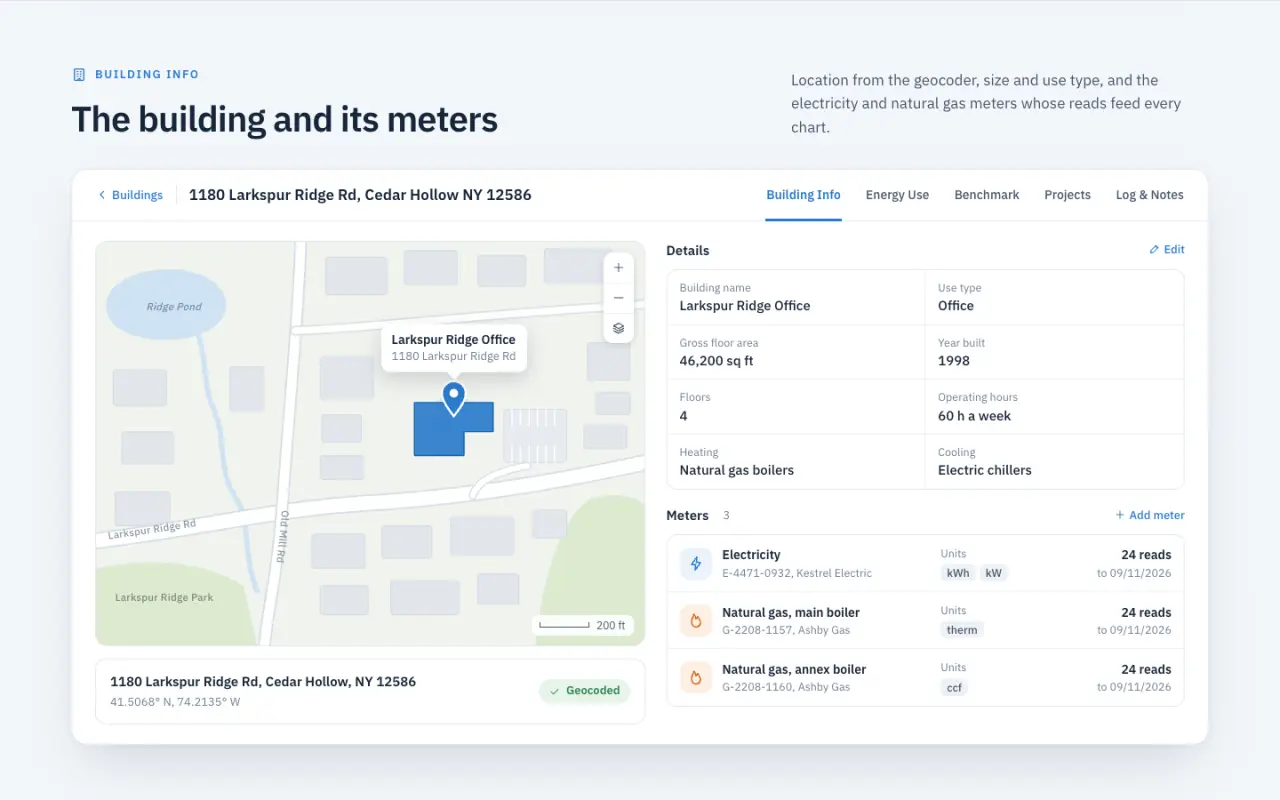
For BuildingEnergy, a renewable energy producer, we built a tool that finds a building by its address, takes its electricity and gas meter reads and shows its energy use over time, next to similar buildings and as a forecast, with projects and notes kept for each building.
To plan efficiency and solar projects, an energy company needs to know how a building uses energy now and where that is heading. BuildingEnergy needed a calculator that turns a building's meter reads into that picture, starting from nothing more than its address.
User stories
What people do with it
- As an energy analyst, I want to find a building by its address and see its meter reads on one chart, so that I understand its energy use in minutes.
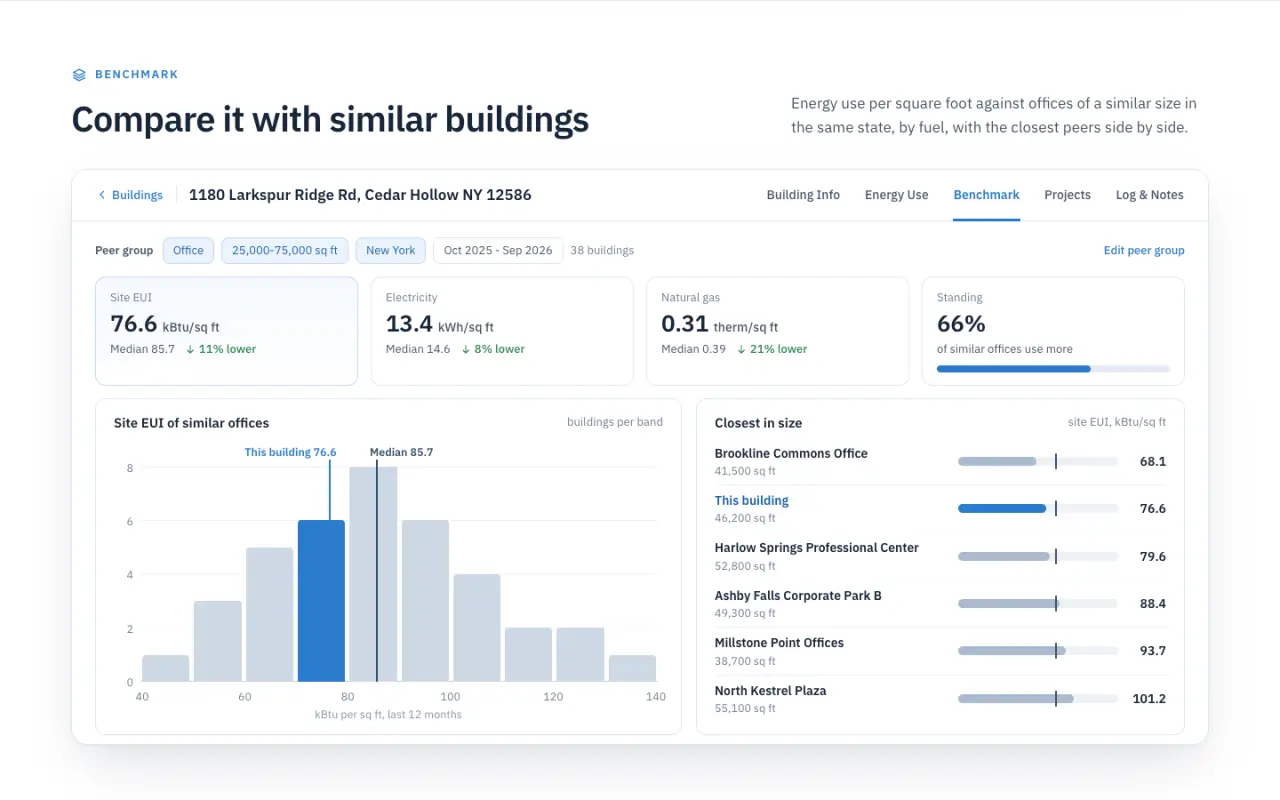
- As an analyst, I want the building shown next to similar ones, so that I know whether its use is high or low.
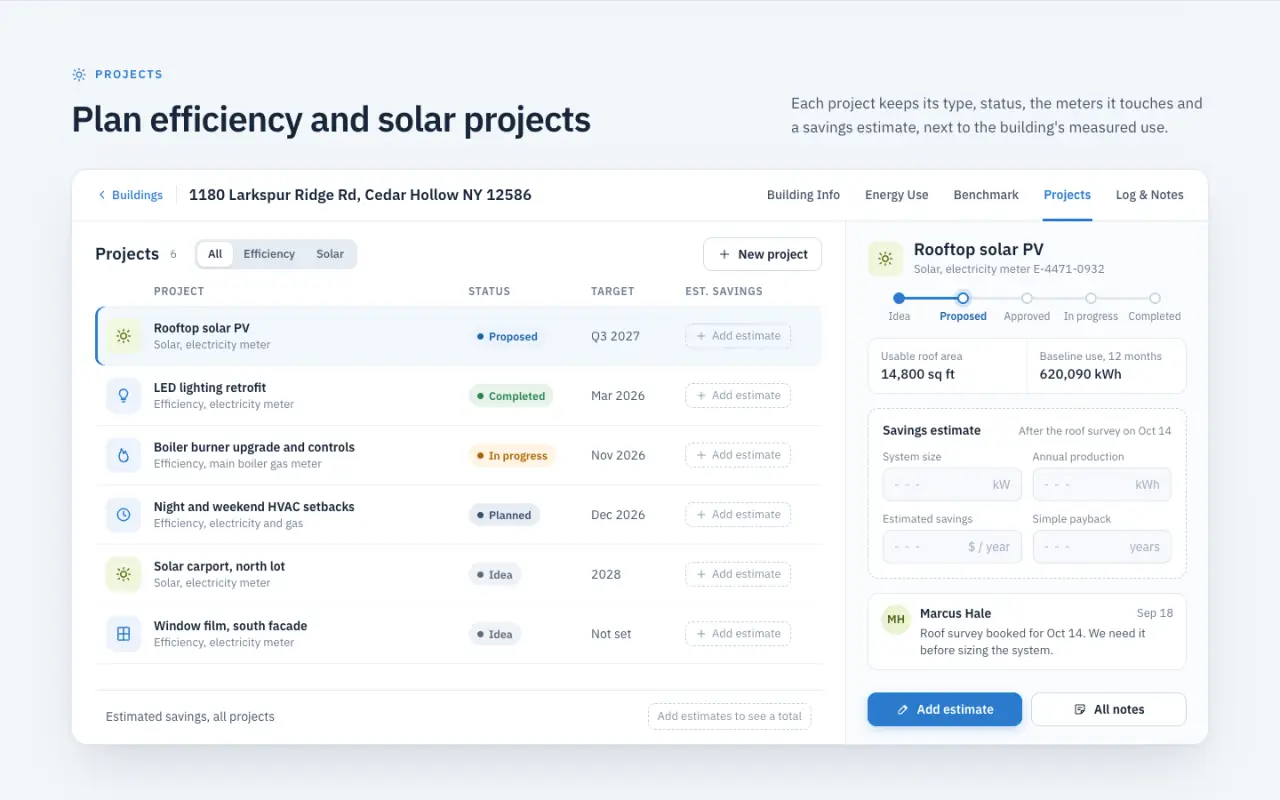
- As a project manager, I want efficiency and solar projects kept with the building, so that the plan and the data live together.
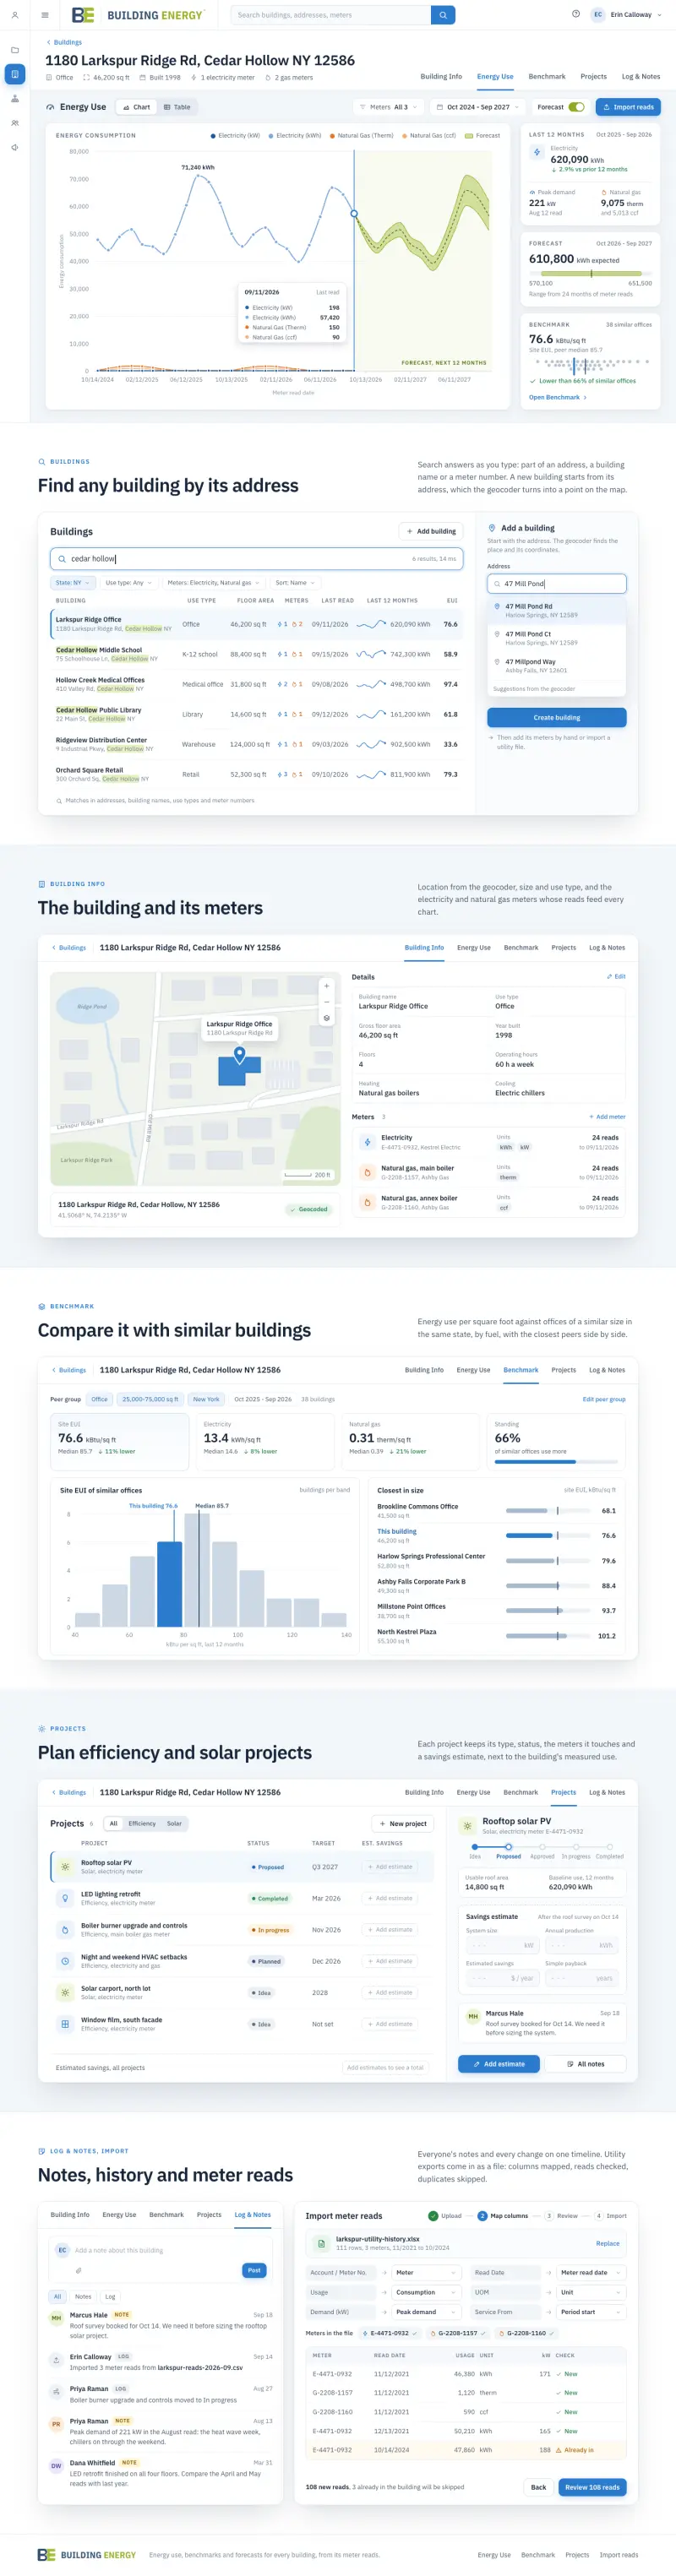

These screens are our rebuild of the tool: the energy use view from its own screenshot, the other tabs from what the tool does. Scroll or drag inside the frames, or click to open full size.
Key challenges
What made it hard
- 01From an address to a building. A geocoder places the building, and Elasticsearch finds it again by any part of its address, its name or a meter.
- 02Units that do not add up by themselves. Electricity in kW and kWh and gas in therms and ccf, read on different dates, share one timeline.
- 03A forecast you can read. The chart carries the reads up to the last one and a forecast band after it, with the same data in a table.
Results
What we delivered
Energy use
Electricity and gas on one chart or table, with a forecast range.
Benchmark
The building next to similar buildings.
Projects
Efficiency and solar projects kept with each building.
Log and notes
The history of each building and the reads behind it.
Technology
Need something like BuildingEnergy?
Tell us about your product. The first call and the rough estimate are free; on outsourced development and staff augmentation there is no upfront payment.
The services behind it: Web Application Maintenance, Custom Web Application Development.
Next case
Intuceo