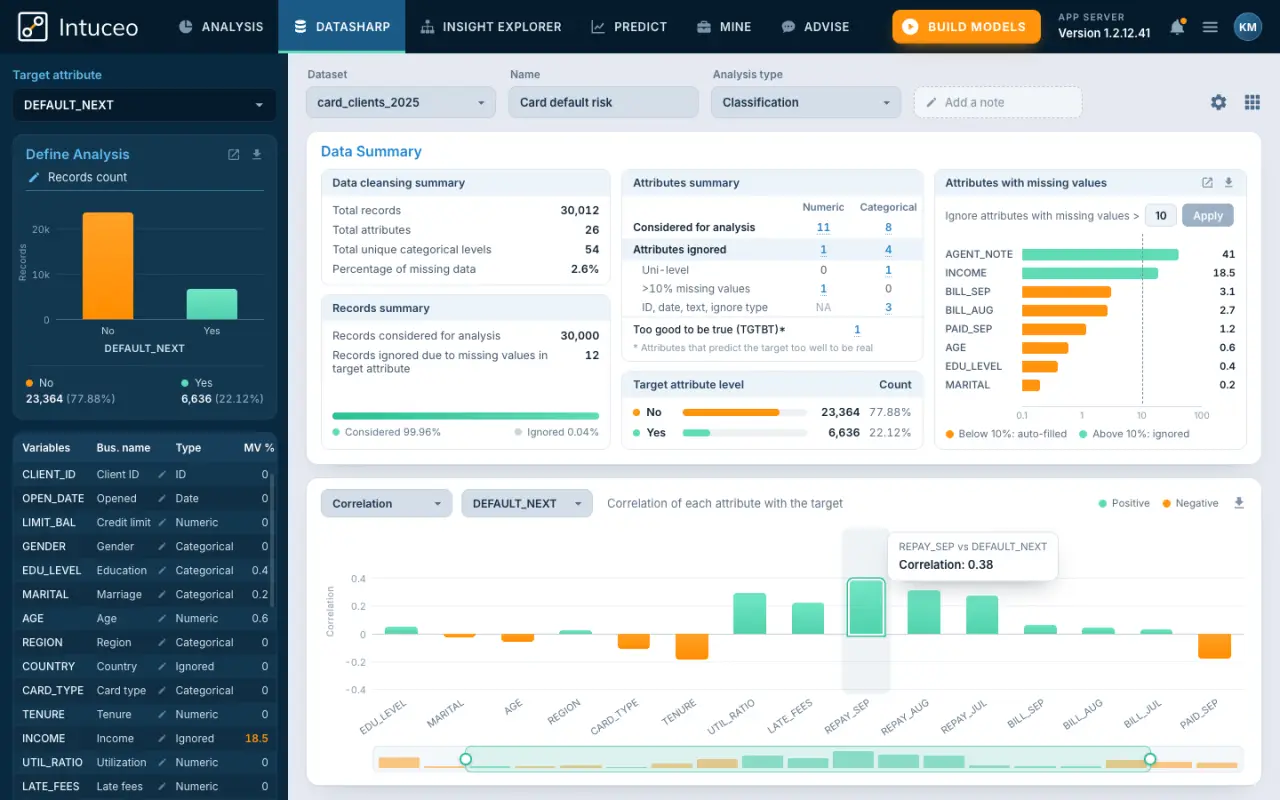
The product moved from server-rendered pages with no API to an Angular app over a Django REST API, with each step of an analysis shown as a chart.
Business context
What the client needed
Intuceo is a cloud augmented analytics platform: analysts load a dataset, it profiles and cleans the data, finds what drives a target metric and builds classification, regression and time-series models. Our team rebuilt its front end as an Angular single-page app and wrote its REST API from scratch.
Intuceo takes business analysts and citizen data scientists from a dataset to a predictive model without code. The product needed a refresh: a modern front end and an API it could grow on.
User stories
What people do with it
- As a business analyst, I want my dataset profiled and cleaned for me, so that I start modelling without a data engineer.
- As an analyst, I want to see which attributes drive my target metric, so that I know where to look before I build a model.
- As the product team, we want a REST API under the app, so that a new screen does not mean a new server page.
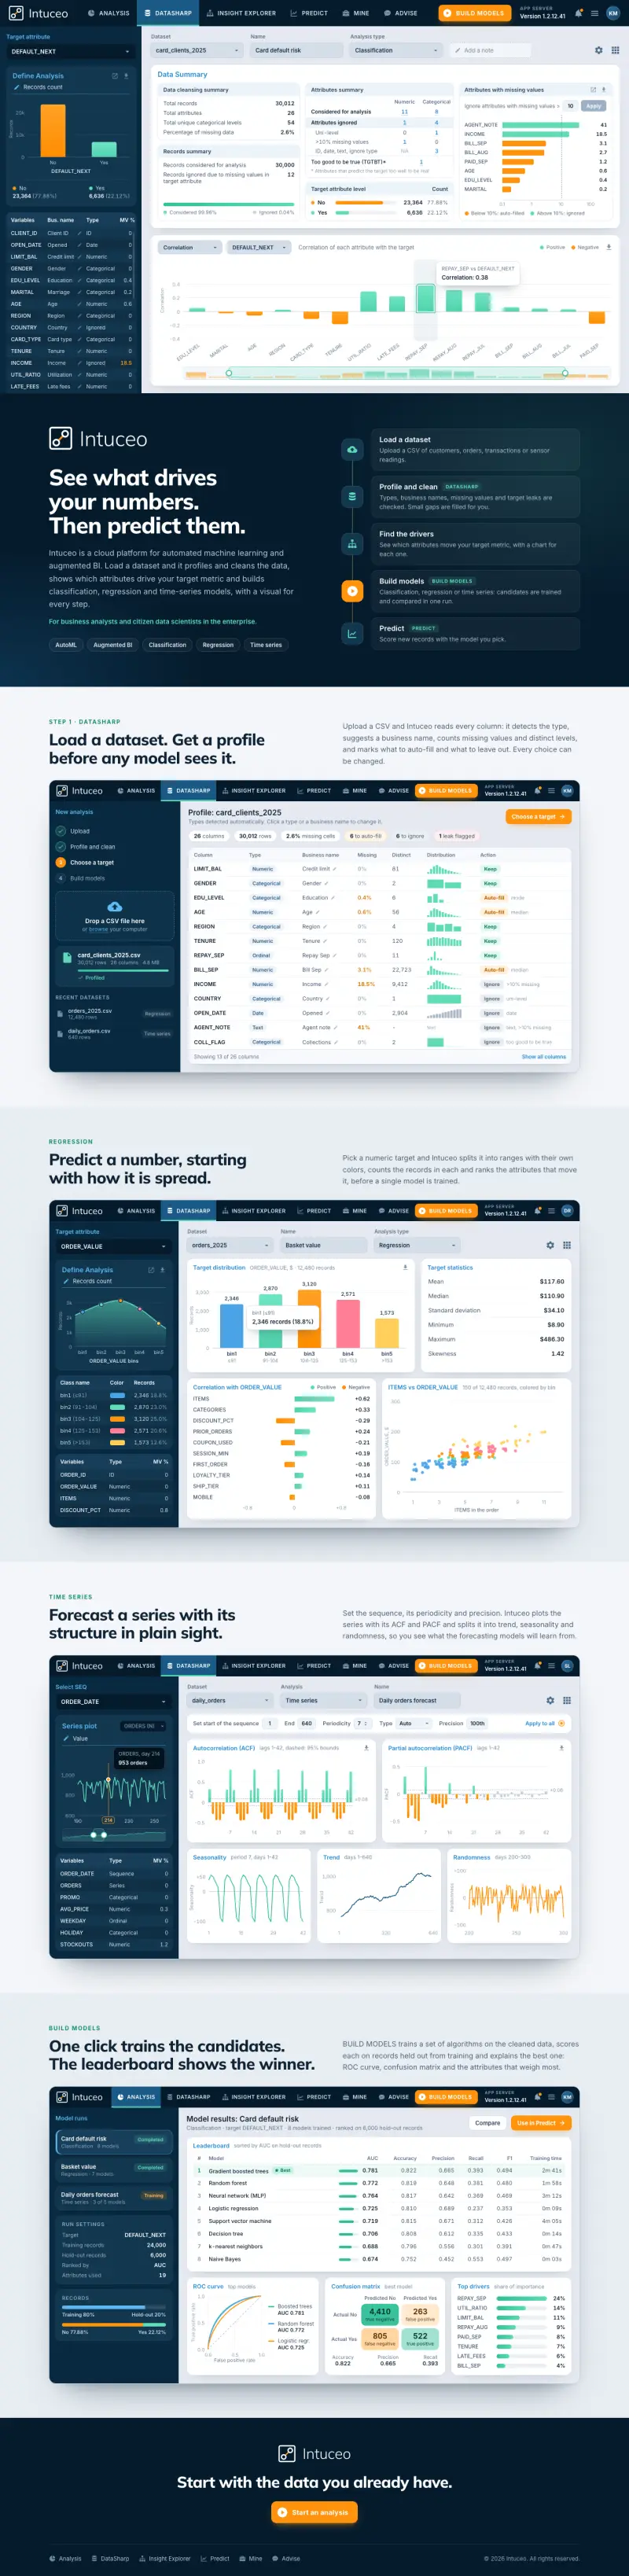

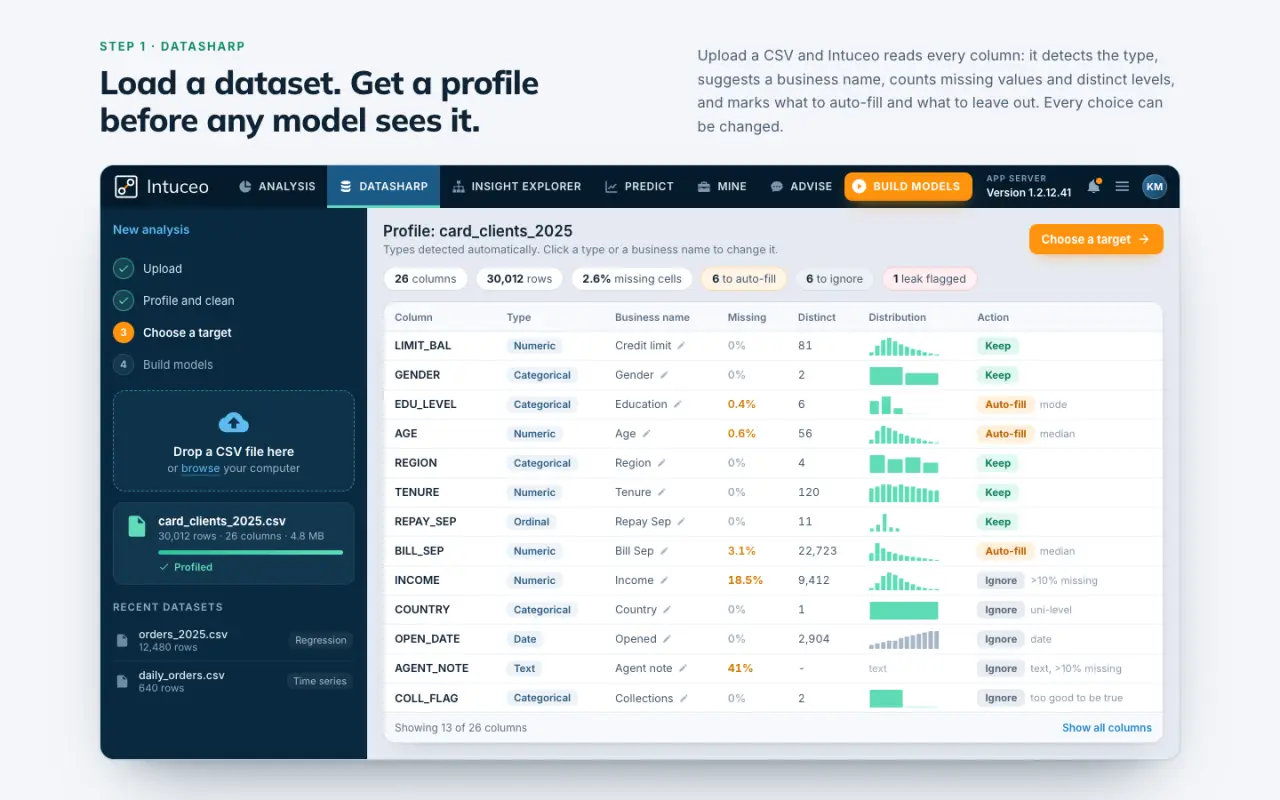
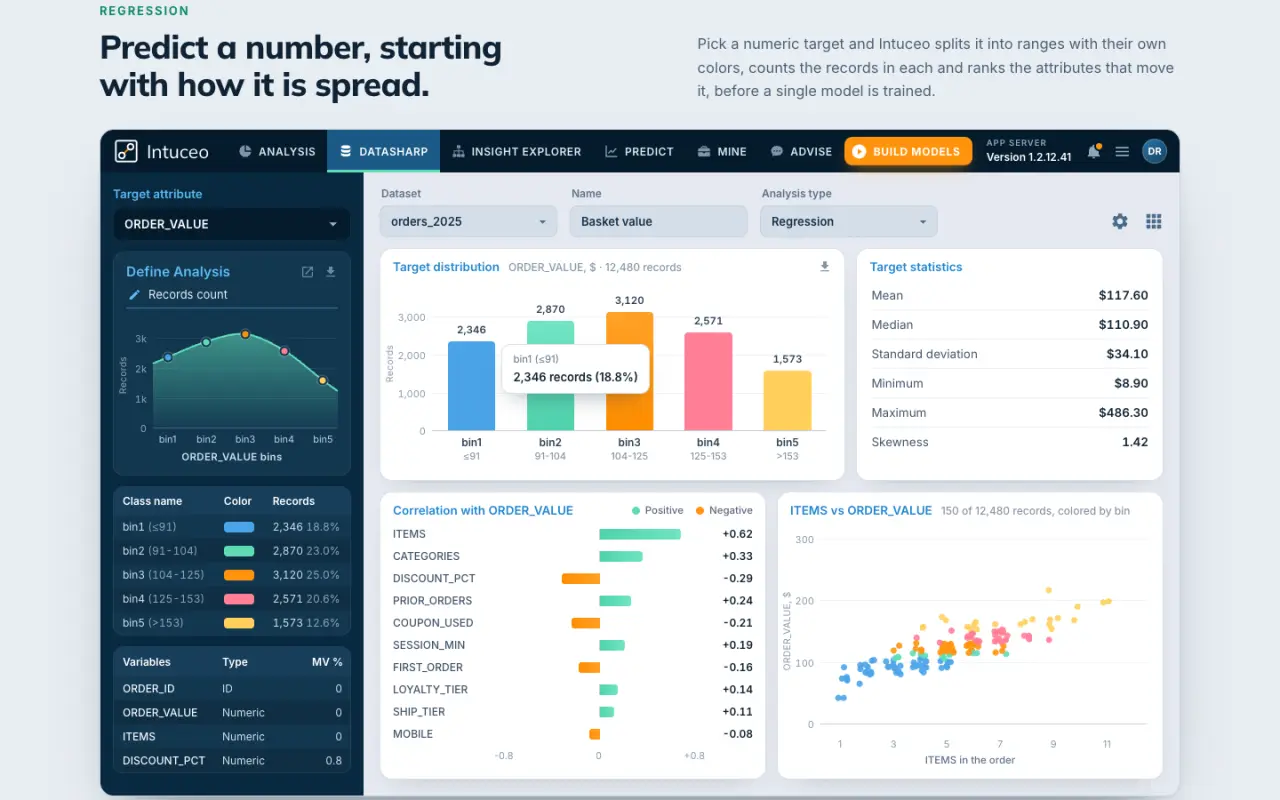
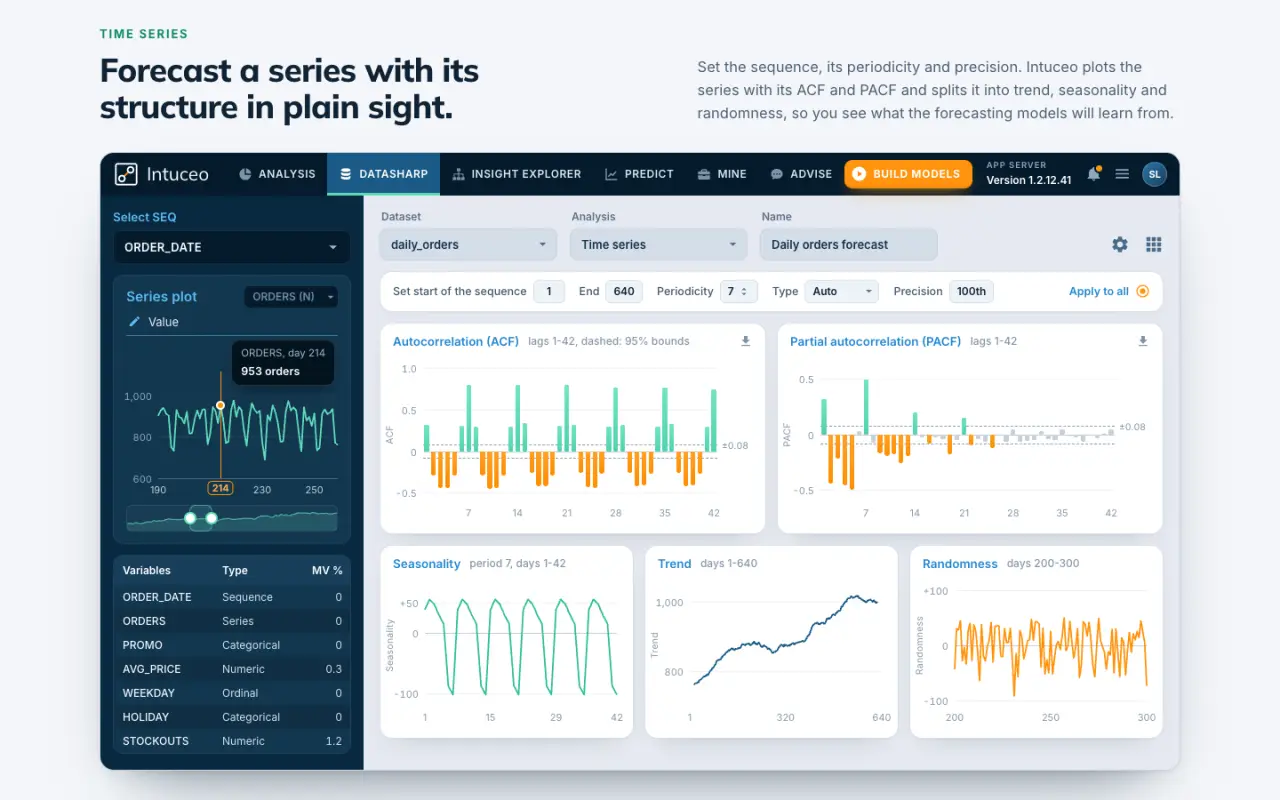
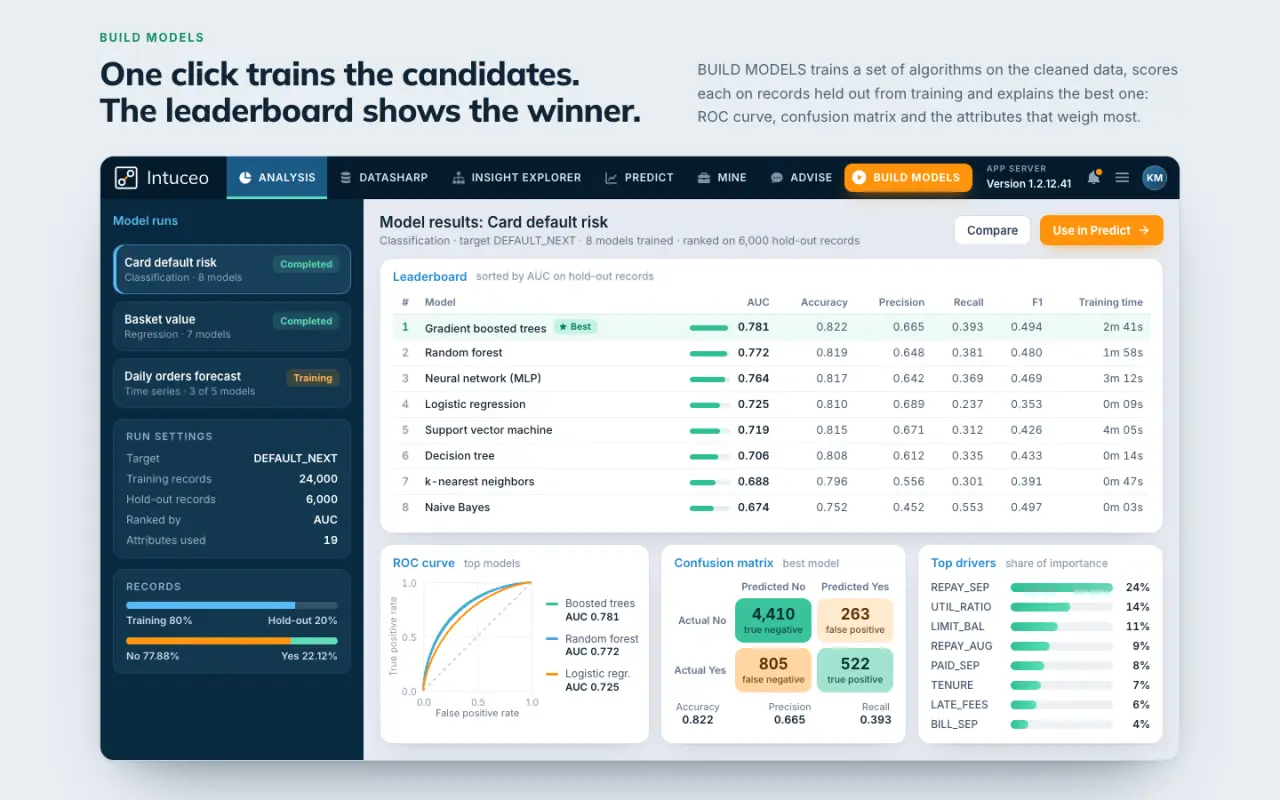
Intuceo has changed since our work, so these screens are our rebuild of it: the analyses from its own screenshots, the upload and the model results from what the platform does. Scroll or drag inside the frames, or click to open full size - or visit intuceo.com .
Key challenges
What made it hard
- 01A new front end for a working product. The interface became an Angular single-page app, with Akita holding its state.
- 02An API where there was none. The old version rendered every page on the server; we wrote the Django REST API the new app runs on from scratch.
- 03Charts that explain the data. Missing values, correlations, distributions, autocorrelation and model results are drawn so an analyst reads them at a glance.
Results
What we delivered
Data profiling
Each column typed and named, its missing values filled or left out by rule.
Drivers of a target
Correlations and distributions that show what moves a metric.
Three kinds of models
Classification, regression and time series, each with its own views.
A stack to grow on
An Angular app over a Django REST API, in Docker on Azure.
Technology
Need something like Intuceo?
Tell us about your product. The first call and the rough estimate are free; on outsourced development and staff augmentation there is no upfront payment.
The services behind it: Custom Web Application Development, Enterprise Web Application Development.
Next case
Somatic Reset